The Cell Ranger
analysis provided by 10X is an excellent start to understanding what might be
going on in the single cells you just sequenced. It allows some basic QC and
this can help determine how well your experiment is working. There is a high degree of variability in the number of cells captured and capture efficiency, but right now we cannot easily see if this is down to the sample (most likely) or the technology.
Some of the metrics
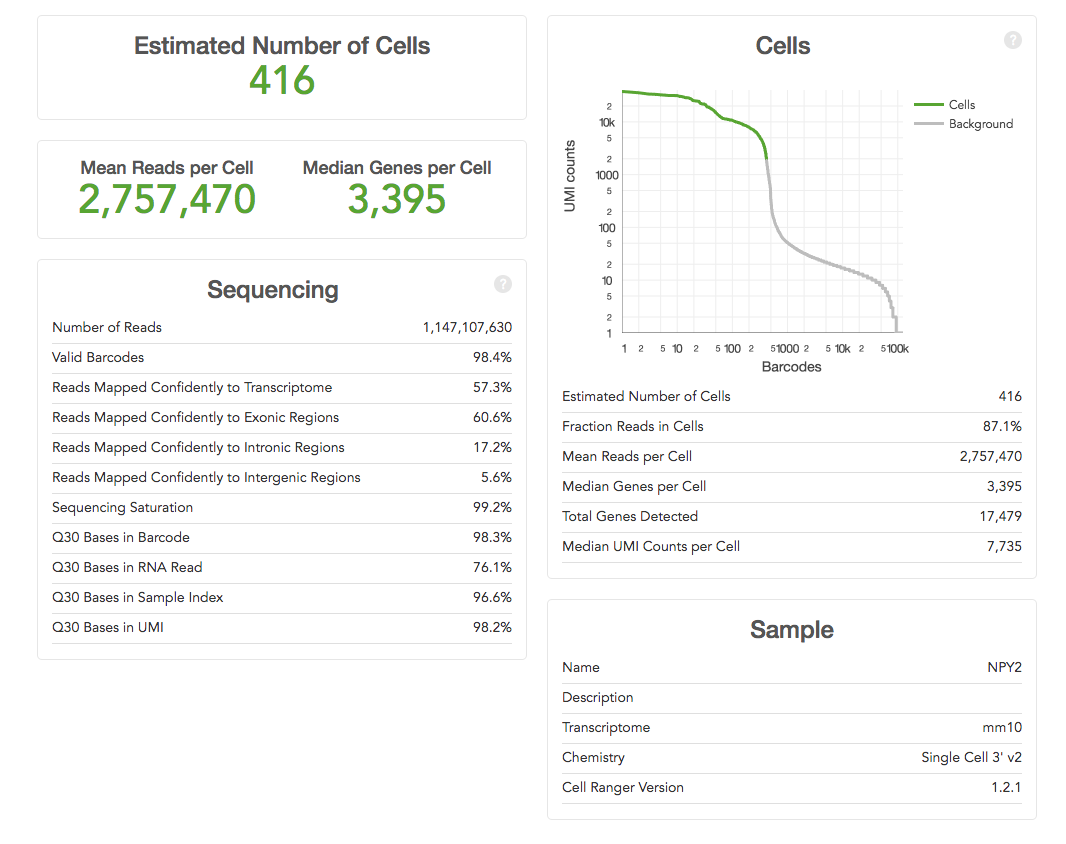
are easy to interpret e.g. the ‘Estimated Number of Cells’ (how many single
cells were captured) – the more the merrier! Others need to be compared across
runs to determine what the “correct” parameters for an experiment might be e.g.
the current 10X recommendation for ‘Mean Reads per Cell’ is 50,000, but you may
find that more, or fewer, reads are required for your samples. You can use the
other metrics such as ‘Median Genes per Cell’ or ‘Sequencing Saturation’ to
help determine when more or less sequencing depth are required.
The most important metrics: 10X help by making the most important stuff big. You should already have an idea of the number of cells you expected to capture (because you carefully counted your cells before starting didn't you), hopeful the ‘Estimated Number of Cells' matches what you were aiming for. Ideally this would be the same across your project, but is likely to be quite variable if the cell types are very different.
The ‘Mean Reads per Cell’ and ‘Sequencing Saturation’ both tell you whether you've over-sequenced. Our recommendation is to run a single lane on hiSeq 400 first and to use these numbers to determine if more sequencing is worth it or not. Diving in for a lane per sample might turn out to be expensive mistake (as it was in the example above).
The ‘Median Genes per Cell’ equals is likely to become a key metric for users. We've become used detecting 10,000-15,000 genes in microarray and RNA-Seq experiments on bulk tissue. What the figure is for single-cell remains to be seen. However it is likely to be quite cell specific, and is also likely to increase as methods capture more of the transcripts.
The ‘Sequencing’ table metrics explained:
- ‘Number of Reads’ equals the total number of single-end reads that were sequenced.
- ‘Valid Barcodes’ equals the fraction of reads with barcodes that match the whitelist.
- ‘Reads Mapped Confidently to Transcriptome’ equals the fraction of reads that mapped to a unique gene in the transcriptome with a high mapping quality score as reported by the aligner.
- ‘Reads Mapped Confidently to Exonic/Intronic/Intergenic Regions’ equals the Fraction of reads that mapped to the exonic/intronic/intergenic regions of the genome with a high mapping quality score as reported by the aligner.
- ‘Sequencing Saturation’ equals the fraction of reads originating from an already-observed UMI. This is a function of library complexity and sequencing depth. More specifically, this is the fraction of confidently mapped, valid cell-barcode, valid UMI reads that had a non-unique (cell-barcode, UMI, gene). This metric was called "cDNA PCR Duplication" in versions of Cell Ranger prior to 1.2.
- ‘Q30 Bases in Barcode/Sample Index/UMI Read’ equals the fraction of bases with Q-score at least 30 in the cell barcode/sample index/Unique molecular identifier sequences.
- ‘Q30 Bases in RNA Read’ equals the fraction of bases with Q-score at least 30 in the RNA read sequences. This is Illumina R1 for the Single Cell 3' v1 chemistry and Illumina R2 for the Single Cell 3' v2 chemistry.
- ‘Estimated Number of Cells' equals the The total number of barcodes associated with cell-containing partitions, estimated from the barcode count distribution.
- ‘Fraction Reads in Cells' equals the The fraction of barcoded, confidently mapped reads with cell-associated barcodes.
- ‘Mean Reads per Cell’ equals the total number of sequenced reads divided by the number of barcodes associated with cell-containing partitions.
- ‘Median Genes per Cell’ equals the median number of genes detected per cell-associated barcode. Detection is defined as the presence of at least 1 UMI count.
- ‘Total Genes Detected’ equals the number of genes with at least one count in any cell.
- ‘Median UMI Counts per Cell’ equals the median number of UMI counts per cell-associated barcode.
It will help to look at these numbers over time and across projects. Right now the data about the sample is limited, but collecting more sample/experiment metadata is likely help determine whether an experiment has worked or not. Right now it is difficult for us to give advice as your experiment may be the first time we've eve3r run that type of cell!